
New Hampshire Coast Flood Risk Model (NHC-FRM)
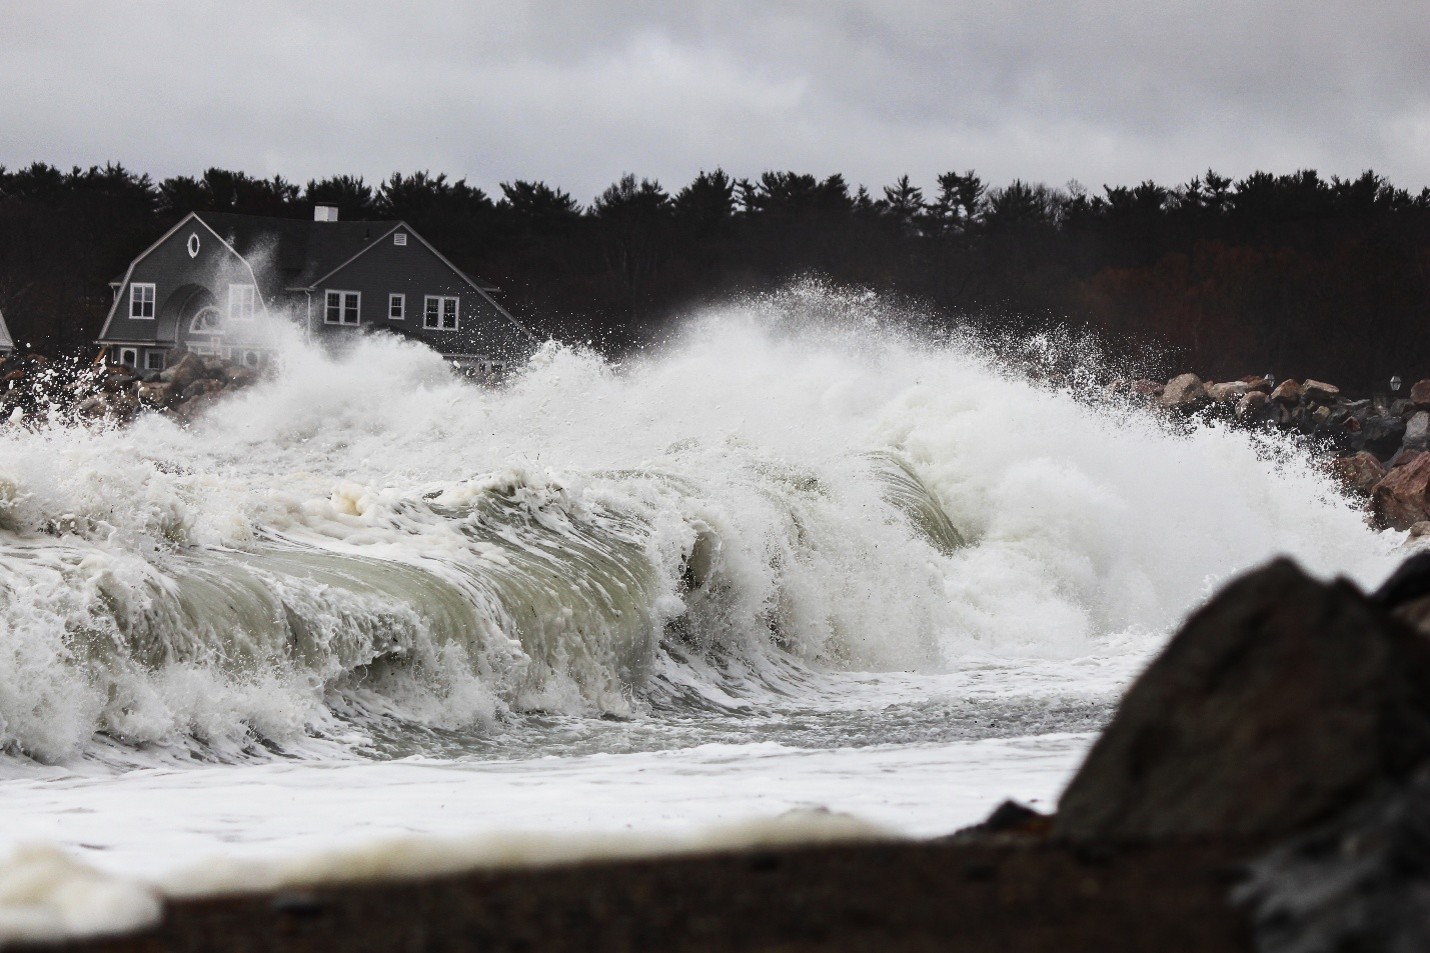
Coastal development in New Hampshire has a long history shaped by fishing, trade, transportation, and tourism. For thousands of years, Indigenous peoples used the Seacoast for fishing, hunting, and settlements. European settlement began in the early 1600s, with fishing communities established at places such as Odiorne Point, the Isles of Shoals, and along the Piscataqua River. Portsmouth soon became the region’s major commercial center because of its deep-water harbor, supporting fishing, lumber, shipbuilding, and overseas trade. During the 18th and 19th centuries, development expanded along the coast as towns such as Hampton, Rye, and Seabrook grew through agriculture, fishing, and maritime industries.
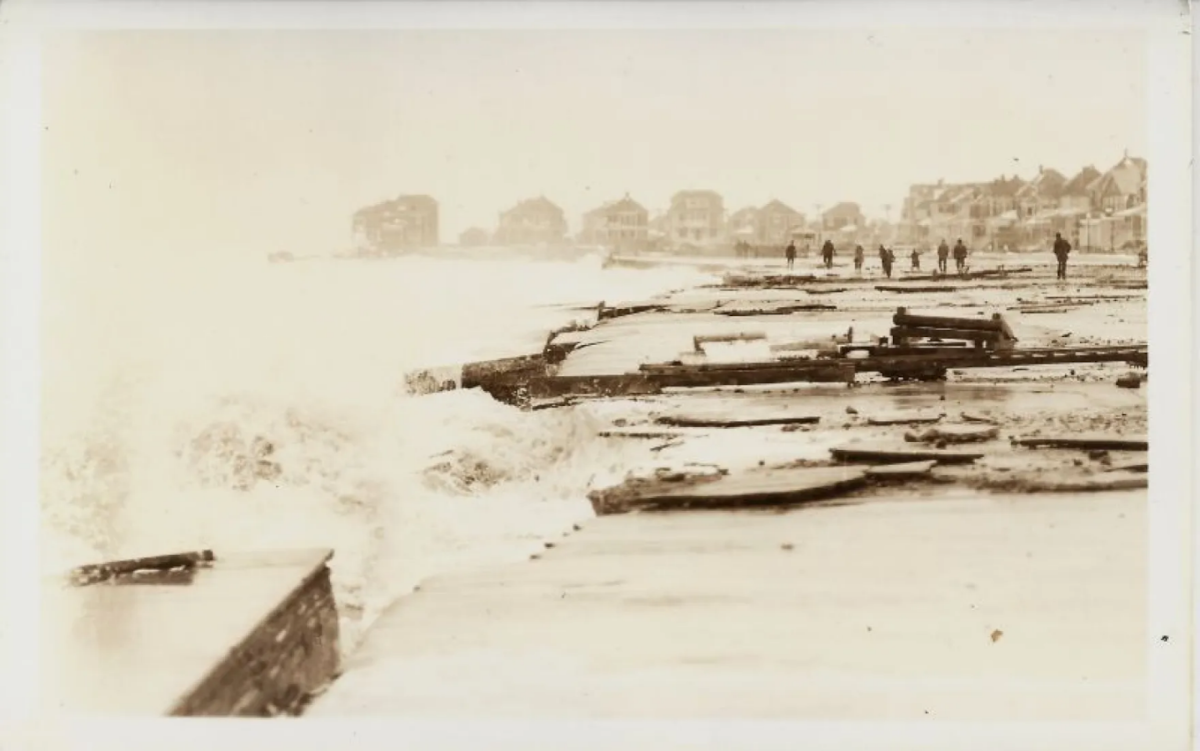
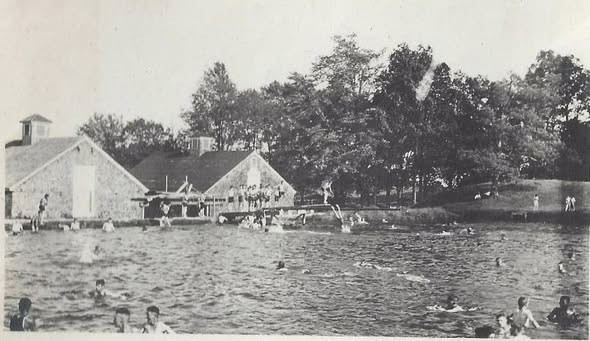
By the late 19th and early 20th centuries, coastal development increasingly shifted toward recreation and tourism, with hotels, cottages, and seasonal homes appearing around beaches such as Hampton Beach and Rye. This transition from a primarily working waterfront to a combination of residential, commercial, and recreational development has contributed to the concentration of people and infrastructure in New Hampshire’s low-lying coastal areas today.
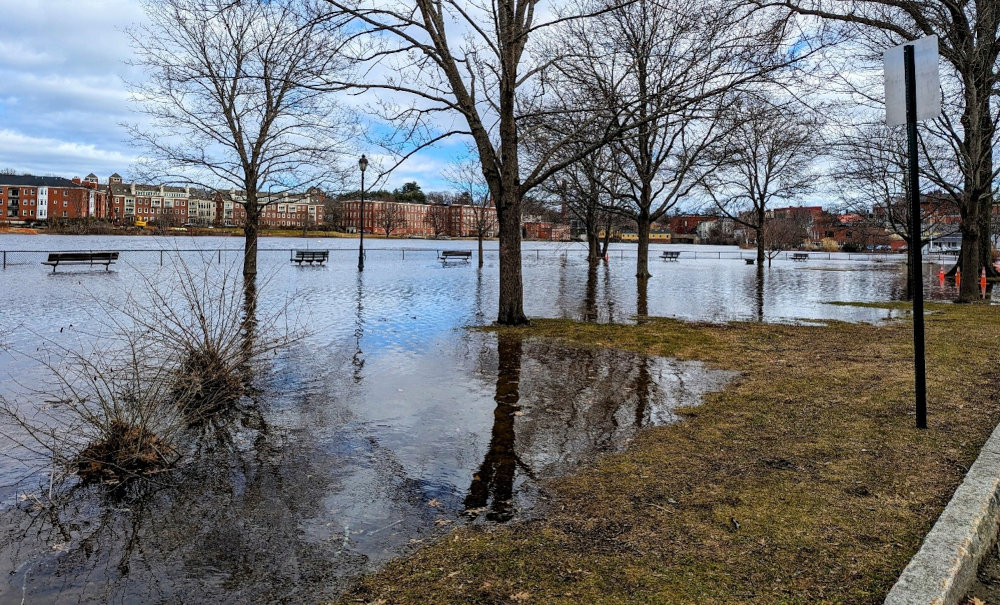
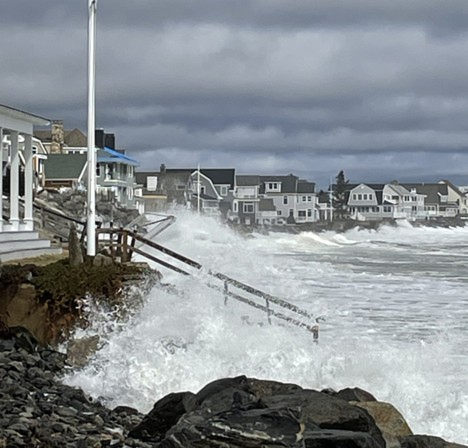
Now, New Hampshire faces an increasing risk of coastal flooding as sea levels rise and coastal storms become more damaging. Along the state’s short but highly developed coastline and Great Bay, higher sea levels are making flooding from high tides and storm surge more frequent. The state’s coastal communities are particularly vulnerable because many homes, roads, wastewater systems, and other critical infrastructure located in low-lying areas. As sea levels continue to rise, flooding that is currently associated with major storms is expected to occur more often, while minor tidal flooding may become increasingly disruptive.
As seas rise and storms impact our coastlines, communities settled along shorelines need access to the most comprehensive information to determine when, where, and how much to invest to decrease potential damage from coastal flooding.
New Hampshire Coast Flood Risk Model
The New Hampshire Coast Flood Risk Model (NHC-FRM) assists property owners, planners and policy makers as they consider ways to effectively build resilience and plan for the expected changes without expending exorbitant resources and funds.
The NHC-FRM is a more accurate representation of flooding risk because it is:
- A dynamic model that includes the critical processes associated with coastal storm induced flooding (winds, waves, wave-setup, storm surge, wave run-up and overtopping, etc.)
- Calibrated to historical storm events that impacted New Hampshire with observed high-water data and measurements
- High enough resolution to capture flood pathways in complex urban topographies
- A model that includes both hurricanes and nor’easters under changing climate conditions
- Able to capture the net effect of varying storm types, magnitudes, and frequencies
Different types of data
This website provides access to the NHC-FRM Basic (Level 1) and Advanced (Level 2) data sets. These include:

Basic (Level 1) Data
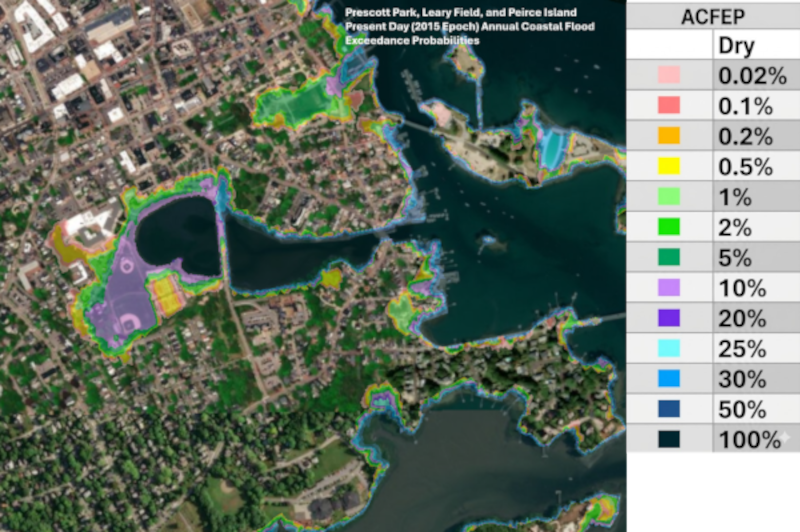
Basic data consists of Annual Coastal Flood Exceedance Probability (ACFEP) data for all climate horizons (sea level rise scenarios) considered (present day, 0.8 ft of SLR, 1.3 ft of SLR, 2.4 ft of SLR, and 3.4 ft of SLR from a 2000 base). All data are ARC-GIS compatible. Basic data also consists of additional supplemental GIS compatible files that include:
- Discharge and Coastal Mixing River Overlay – Identifies locations where under higher discharge/stage conditions, compound flooding of fluvial and coastal flooding may exceed the coastal flooding only ACFEP values presented in the NHC-FRM. In areas without the overlays, high discharge conditions (up to a 500-year return period level) do not significantly change the coastal flood risk levels. This does not mean that fluvial based flooding isn’t important in all areas, nor that fluvial based flooding could not occur in these areas. Rather, it means in combined conditions, fluvial flooding does not add to the level of coastal based flooding.
- Culvert Overlay – Identifies locations where culverts were not explicitly modeled. These crossings are usually too small or irrelevant for other reasons (e.g., flanked from other areas, etc.). A vast majority of these situations/areas are in undeveloped areas where flooding that could occur from water propagating just through the culvert would not result in any infrastructure flooding.
- Wave Overtopping Overlay – Identifies areas that would be flooded due to wave overtopping (e.g., splash over occurring due to wave action at coastal structures such as seawalls and revetments) during various ACFEP levels. These areas experience intermittent pulses of water entering the area during wave crest interaction with the shoreline/structure.

Advanced (Level 2) Data
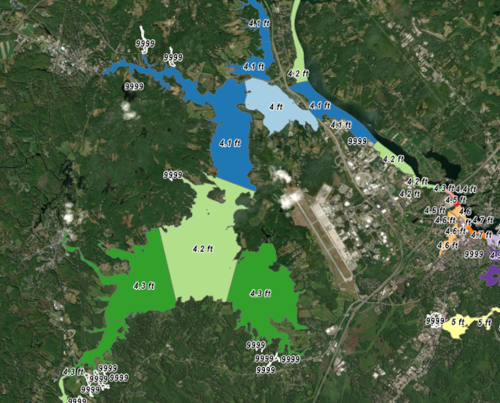
These data include coastal state-wide water surface elevations, significant wave heights, and Tidal Datums for all projected sea level rise scenarios (0.8 ft of SLR, 1.3 ft of SLR, 2.4 ft of SLR, and 3.4 ft of SLR from a 2000 base). These data files cover the entire coastally influenced part of the State of New Hampshire and are all ARC-GIS compatible. Data sets include:
- Tidal Datums – Provides MHHW, MHW, MTL, MLW, and MLLW values throughout the state for all projected sea level rise values. Hatched areas in this data set indicate locations where site-specific data collection may be needed to accurately determine tidal attenuation through restrictive structure (e.g., smaller culverts).
- Significant Wave Heights – Significant wave height data in overland flooded areas throughout the state for each sea level rise projection at the 4% (25-year), 10% (10-year), 1% (100-year), and 0.2% (500-year) ACFEP (return period) levels.
- Stillwater Water Surface Elevations – Stillwater water surface elevation data in overland flooded areas throughout the state for each sea level rise projection at the 4% (25-year), 10% (10-year), 1% (100-year), and 0.2% (500-year) ACFEP (return period) levels.
For design projects, reviewers should use the Advanced water surface elevation data.
Additional Documents
Additional documents are available that provide definitions, answers to FAQs, FACT sheets, and metadata can be downloaded here as well.
NHC-FRM Data
Download data now
Get access to the NHC-FRM Level 1 and Level 2 data by filling out this form. Once complete, access will be granted to a data download page where you can select the data you would like to download.
“These datasets are provided without any guarantees or warranty. In association with the product, Woods Hole Group and the State of New Hampshire makes no warranties of any kind, either express or implied, including but not limited to warranties of merchantability, fitness for a particular purpose, of title, or of noninfringement of third party rights. Use of these datasets by a user is at the user’s risk. No warranties of any kind, expressed or implied, are provided, including usage, merchantability, content, interpretation, sequence, accuracy, currency or timeliness. This information is not intended for use as a flood insurance determination, nor should it be directly related to FEMA FIRM maps or data since these data and FEMA data are for different purposes. This information cannot be used for the purpose of boundary resolution or location.
This public information is furnished by Woods Hole Group and the State of New Hampshire should be accepted and used by the recipient with the understanding that the data received were developed and collected for future flooding analyses purposes only. No liability is assumed as to the accuracy, sufficiency or suitability of the information contained herein for any other particular use. Woods Hole Group assumes no liability whatsoever associated with the use or misuse of such data.
While every effort has been made to assure the accuracy and correctness of the data presented, it is hereby acknowledged that inherent mapping inaccuracies may be present due to elevation uncertainties in existing topographic data and interpolation between NHC-FRM calculation nodes. Any reliance upon the data presented herein used to make decisions or conclusions is at the sole discretion and risk of the user. This information is provided with the understanding that these data are not guaranteed and assumes no responsibility for errors or omissions. All data are subject to constant change given the changing climate. NHC-FRM data may lag behind real-world changes by varying periods of time.