Massachusetts Coast Flood Risk Model (MC-FRM)

Massachusetts’ coastal communities were settled during a time when sea levels were remarkably stable.
For centuries, natural and built infrastructure such as salt marshes, dune communities, seawalls and bulkheads have allowed people to live, work and play at the edge of the ocean with well-understood, manageable risks of flood damage.
However, increases in global temperatures have resulted in 16 of the 17 warmest years on record occurring from 2001 to 2017. People born after 1980 have never experienced a cooler-than-average year. As global temperatures rise, so do sea levels (melting ice sheets, expansion of water), and the Mid-Atlantic and Northeast US coasts are experiencing faster-than-average sea level rise.
As seas rise and storms impact our coastlines, communities need access to the most comprehensive information to determine when, where, and how much to invest to decrease potential damages from coastal flooding.
The Massachusetts Coast Flood Risk Model (MC-FRM) helps property owners, planners and policy makers consider ways to cost-effectively build resilience and plan for the expected changes.
Massachussetts Coast Flood Risk Model
The Massachusetts Coast Flood Risk Model (MC-FRM) helps property owners, planners and policy makers consider ways to cost-effectively build resilience and plan for the expected changes.
The MC-FRM is a more accurate representation of flooding risk because it is
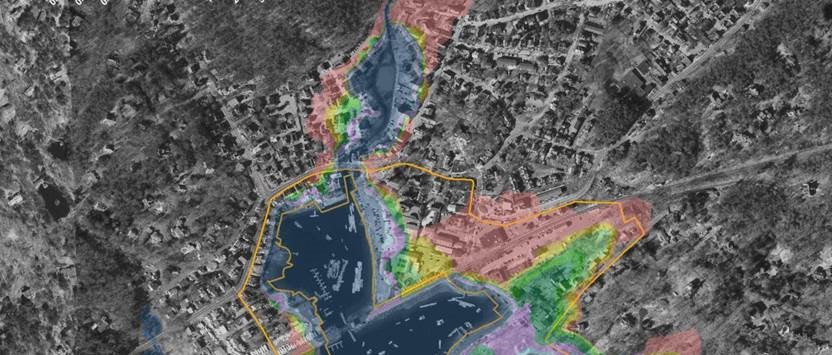
- a dynamic model that includes the critical processes associated with storm induced flooding (winds, waves, wave-setup, storm surge, wave run-up and overtopping, etc.),
- calibrated to historical storm events that impacted Massachusetts with observed high water data and measurements,
- high enough resolution to capture flood pathways in complex urban topographies,
- a model that includes both hurricanes and nor’easters under changing climate conditions,
- and able to capture the net effect of varying storm types, magnitudes, and frequencies.
Different types of data
This website provides access to the MC-FRM Level 1 and Level 2 data sets. These include:

Level 1 Data
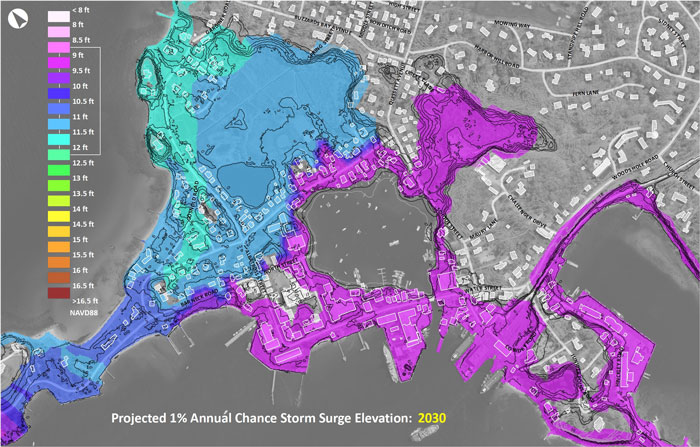
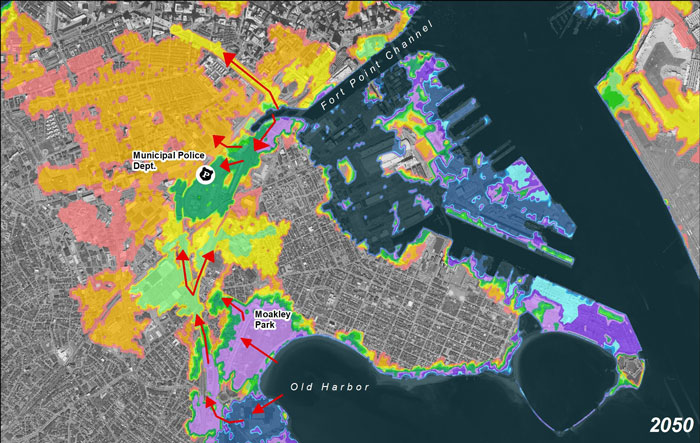
This includes the annual coastal flood exceedance probability (ACFEP) data, the depth data for 3 ACEFP levels (1%, 0.5%, and 0.1%), and some ACFEP extent shapefiles. Data are available for present day (2008 tidal epoch), 2030, 2050, and 2070.
They are organized based on a Town/City with a buffer around each Town.
These data also include a readme file, disclaimer, FAQ sheet, and metadata. Data are provided as ARC-GIS compatible raster data set with a layer file that can be applied if so desired.

Level 2 Data
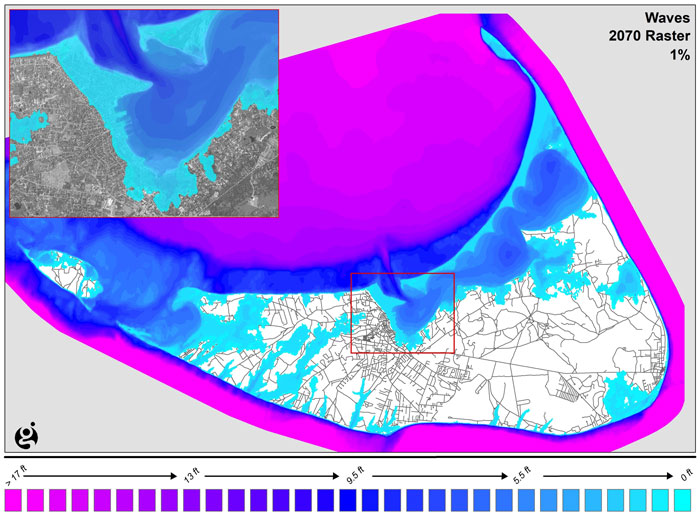
These data include coastal state-wide water surface elevations, maximum wave heights, and Maximum Wave Crest Elevation (or Maximum Wave Action Elevation or Design Flood Elevations) for 3 climate years (2030, 2050, and 2070) and at 6 various annual coastal flood exceedance probability levels (0.1%, 0.2%, 0.5%, 1%, 2%, and 5%). There are also tidal benchmark data that cover 2030, 2050, and 2070. These are the same data that were provided to EOEEA for the RMAT Tool.
These data files cover the entire coastal influenced part of the State of Massachusetts and are all ARC-GIS compatible. The water surface elevation data are a more accurate version of the depth data intended for design purposes.
Level 2 data also include hatching files that describe special areas (e.g., overtopping zones, etc.).
Please do NOT try to compare the Level 1 depth data to the Level 2 water surface elevation data.
You should generally try to use the Level 2 water surface elevation data before the Level 1 depth data if you are doing design projects. The level 1 depth data were only produced for as a general lay-person friendly data set, the water surface elevation data are much more accurate and can be used to get more specific depth data if you know the elevation of the topography at the site.
Additional Documents
Additional documents are available that provide definitions, provide answers to FAQs, and explains all the data (a layperson friendly metadata sheet) and can be downloaded here as well.
MC-FRM Training Series of Workshops
For a more comprehensive explanation of the MC-FRM development, data types, important definitions, and applications. The MC-FRM training series of workshops can be viewed:

Workshop 1: Overview and Level 1 (Basic) Data
This workshop covers the history of the Massachusetts Coast Flood Risk Model (MC-FRM), including an overview of the model and its development. Storm climatology, sea level rise, and other model inputs are described, and model advantages and limitations are also covered. Some critical basic definitions are described so that users can be familiar with terms and the data. The workshop concludes with a presentation and description of the Level 1 MC-FRM data, as well as data viewing and downloading locations.
Read more

Workshop2: Level 2 Data (Advanced) and Application
This workshop covers details associated with the Level 2 data output, including the special zones. Additional definitions for the Level 2 data are also detailed. This workshop also provides some comparisons between the MC-FRM and other available models and data sets. Some interactive GIS exercises are also included.
Read more

Workshop 3: Technical Application
This workshop provides a review of the Level 1 and Level 2 data, while also covering some example applications of the MC-FRM data. Definitions are reviewed and additional definitions are discussed. Flexible design considerations and additional specific technical data types are presented. A further discussion of comparison to other data sets is also provided.
Read more
MC-FRM Data
Download data now
Get access to the MC-FRM Level 1 and Level 2 data by filling out this form. Once complete you will have access to a data download page where you can select the data you would like to download.
“These datasets are provided without any guarantees or warranty. In association with the product, Woods Hole Group and the State of Massachusetts makes no warranties of any kind, either express or implied, including but not limited to warranties of merchantability, fitness for a particular purpose, of title, or of noninfringement of third party rights. Use of these datasets by a user is at the user’s risk. No warranties of any kind, expressed or implied, are provided, including usage, merchantability, content, interpretation, sequence, accuracy, currency or timeliness. This information is not intended for use as a flood insurance determination, nor should it be directly related to FEMA FIRM maps or data since these data and FEMA data are for different purposes. This information cannot be used for the purpose of boundary resolution or location.
This public information is furnished by Woods Hole Group and the State of Massachusetts should be accepted and used by the recipient with the understanding that the data received were developed and collected for future flooding analyses purposes only. No liability is assumed as to the accuracy, sufficiency or suitability of the information contained herein for any other particular use. Woods Hole Group assumes no liability whatsoever associated with the use or misuse of such data.
While every effort has been made to assure the accuracy and correctness of the data presented, it is hereby acknowledged that inherent mapping inaccuracies are present due to interpolation between MC-FRM calculation nodes. Any reliance upon the data presented herein used to make decisions or conclusions is at the sole discretion and risk of the user. This information is provided with the understanding that these data are not guaranteed to be accurate, correct or complete and assumes no responsibility for errors or omissions. All data are subject to constant change given the changing climate. MC-FRM data may lag behind real-world changes by varying periods of time.
Users should not attempt to back calculate a water surface elevation or depth. Although it may seem logical to do so, this assumes (1) the elevation data used are consistent with the elevation data source that were used in the model, (2) the exact spatially proximity of the model node is consistent with the elevation data and (3) the elevation data the user applies will be inconsistent with the model DEM, which has to be interpolated, as well as the model depth output raster, which is also interpolated. Both of those may use different interpolation schemes.”